Guides for SE student projects »
Intellij IDEA: Using the debugger
This tutorial covers basics of the Intellij IDEA's debugging features.
If you are new to using an IDE-based debugger, we recommend that you watch the following video (from LaunchCode) which gives a pretty good explanation of how to use the IntelliJ IDEA debugger.
To recall how to use a specific feature, you can use the sections below.
Setting breakpoints
Purpose: A breakpoint is a line in the code at which the debugger will pause the execution.
How: Click on the left gutter of the editor pane, at the line where you want to breakpoint. A red dot will appear to indicate the breakpoint.

[image credit: Intellij Docs]
To remove the breakpoint, click the red dot again.
Video segment 3.09 - 3.30 :
More info from Intellij Docs is here.
Running the code in 'debugger mode'
Purpose: To get Intellij to run the code in the debugger mode, so that the debugger can direct the execution flow as needed by the debugging.
How: There are several ways. One of them is to click the icon in the gutter near the class with the main() method and select Debug.

[image credit: Intellij Docs]
Video segment 3.53 - 4.00 :
More info from Intellij Docs is here.
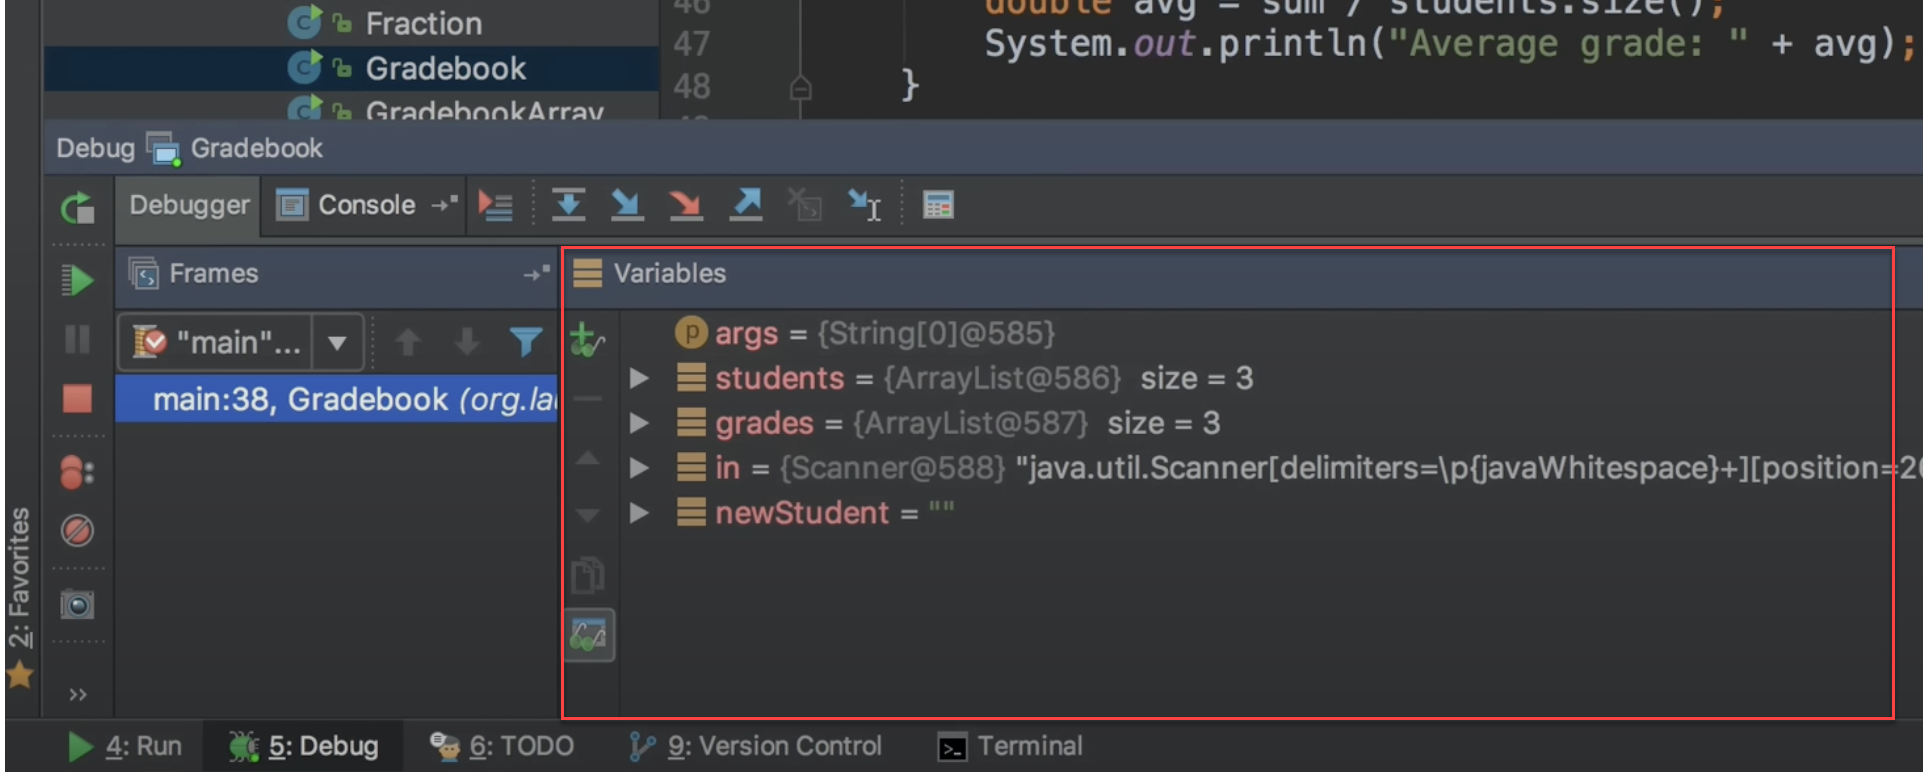
Examining the state of the suspended program
Purpose: To examine variable values at a specific step of the execution.
How: Use the Debugger tool window (the bottom part of the screenshot below). Current value of each variable is listed in the panel on the bottom right.
[image credit: LaunchCode]
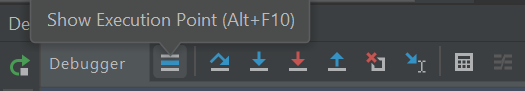
Show execution point feature can be used to jump to the line of code that the debugger has stopped at (in case the line is not currently visible in the code editor):
Video segment 4.41 - 6.06 :
More info from Intellij Docs is here.
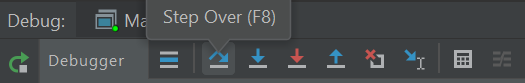
Stepping through code
Purpose: Executes the current statement, and move to the next statement.
How: Click the Step Over button in the debugger toolbar, as shown below.
[image credit: se-edu]
Video segment 7.30 - 7.55 :
More info from Intellij Docs is here.
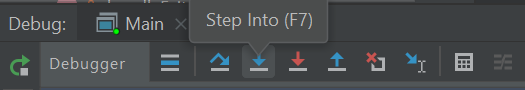
Stepping into a method
Purpose: Suppose the current statement calls another method, and you are interested to see how the execution goes through that method. Here, you can step into that method.
How: Click the Step Into button in the debugger toolbar, as shown below.
[image credit: se-edu]
Video segment 13.05 - 13.35 :
When trying to step into a statement such as storage.saveAddressBook(model.getAddressBook()) which contains multiple method calls, Intellij will let you choose (by clicking) which one you want to step into.
More info from Intellij Docs is here.
Stepping out of a method
Purpose: Executes the remaining lines of code in the current method and returns to the caller.
Used when you've stepped into a method, stepped through some of it, and now want to return to the caller method without stepping through the remainder of the current method.
How: Click the Step Out button in the debugger toolbar, as shown below.
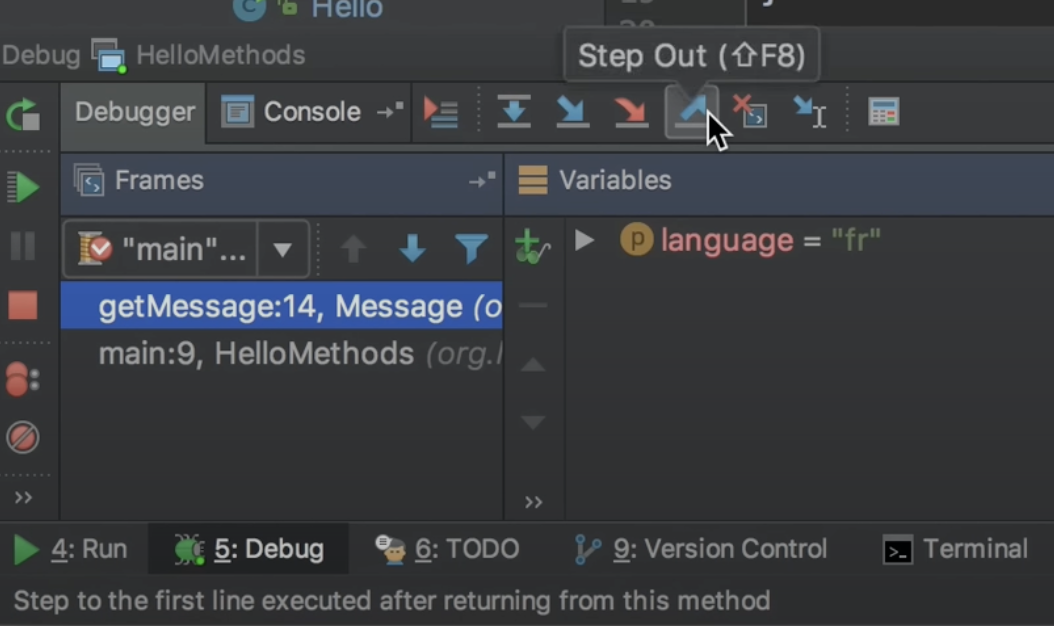
[image credit: LaunchCode]
Video segment 13.45 - 13.55 :
More info from Intellij Docs is here.
Setting a conditional breakpoint
Purpose: To pause the execution at a certain breakpoint only when a certain condition is met e.g., to stop at a breakpoint only when the 100th iteration of a loop.
How: Right-click on a breakpoint and enter a condition (e.g., i == 5)
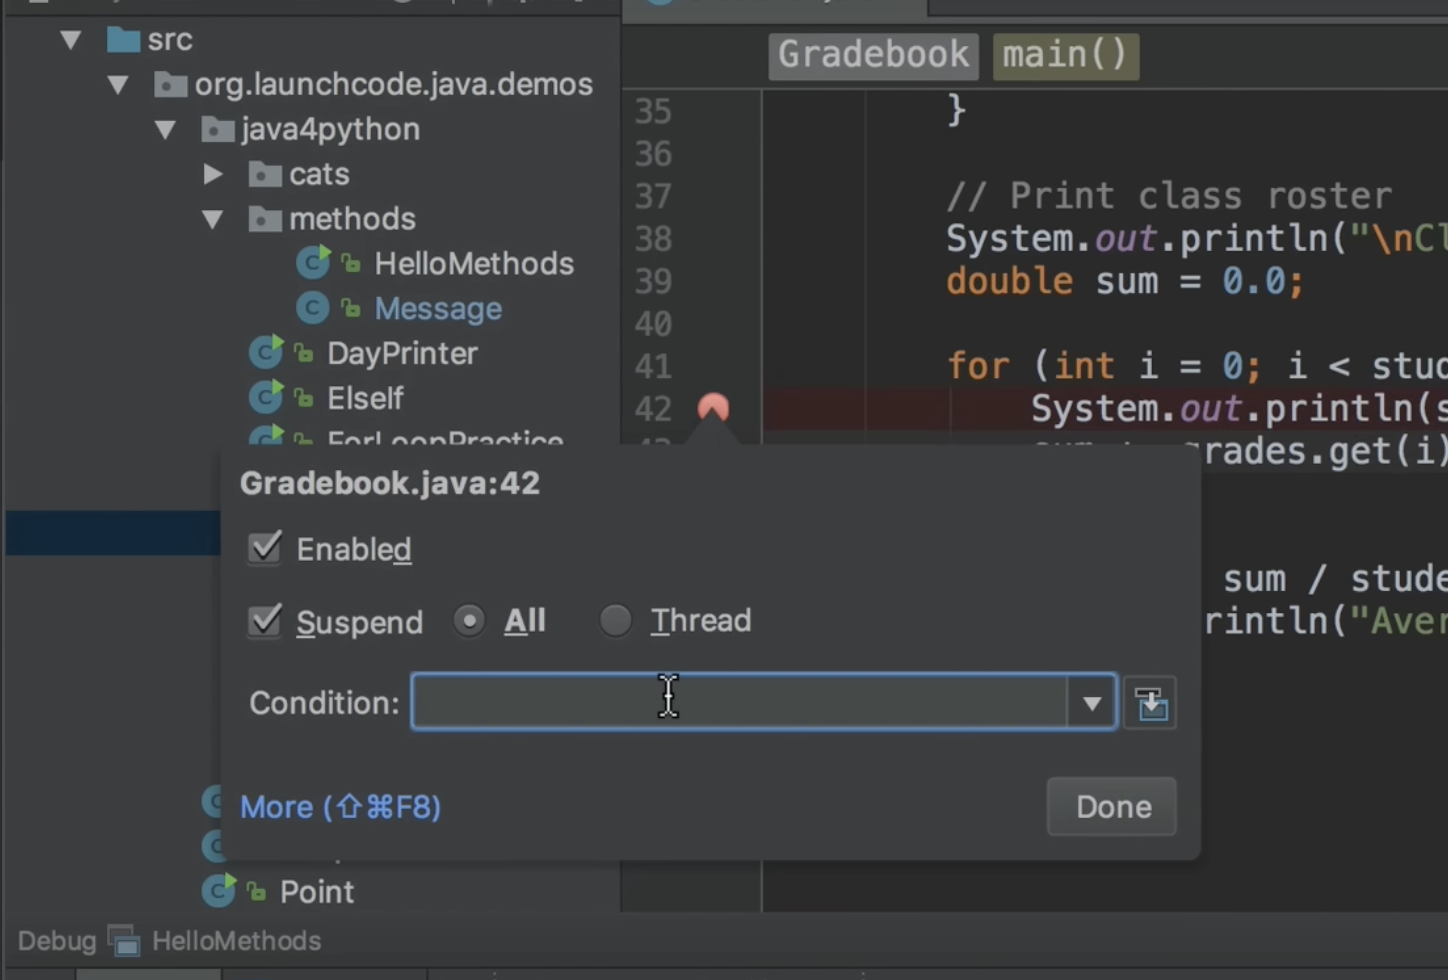
[image credit: LaunchCode]
Video segment 15.20 - 16.45 :
Evaluate expression
Purpose: Allows you to compute the value of an expression at a specific point during execution, enabling dynamic inspection of variables and data structures.
e.g., while debugging, you want to find the result of expressions truncate(myVariable * 2) based on the current value myVariable
How: Enter it in the Evaluate expression field in the Variables pane (shown below) and press Enter.
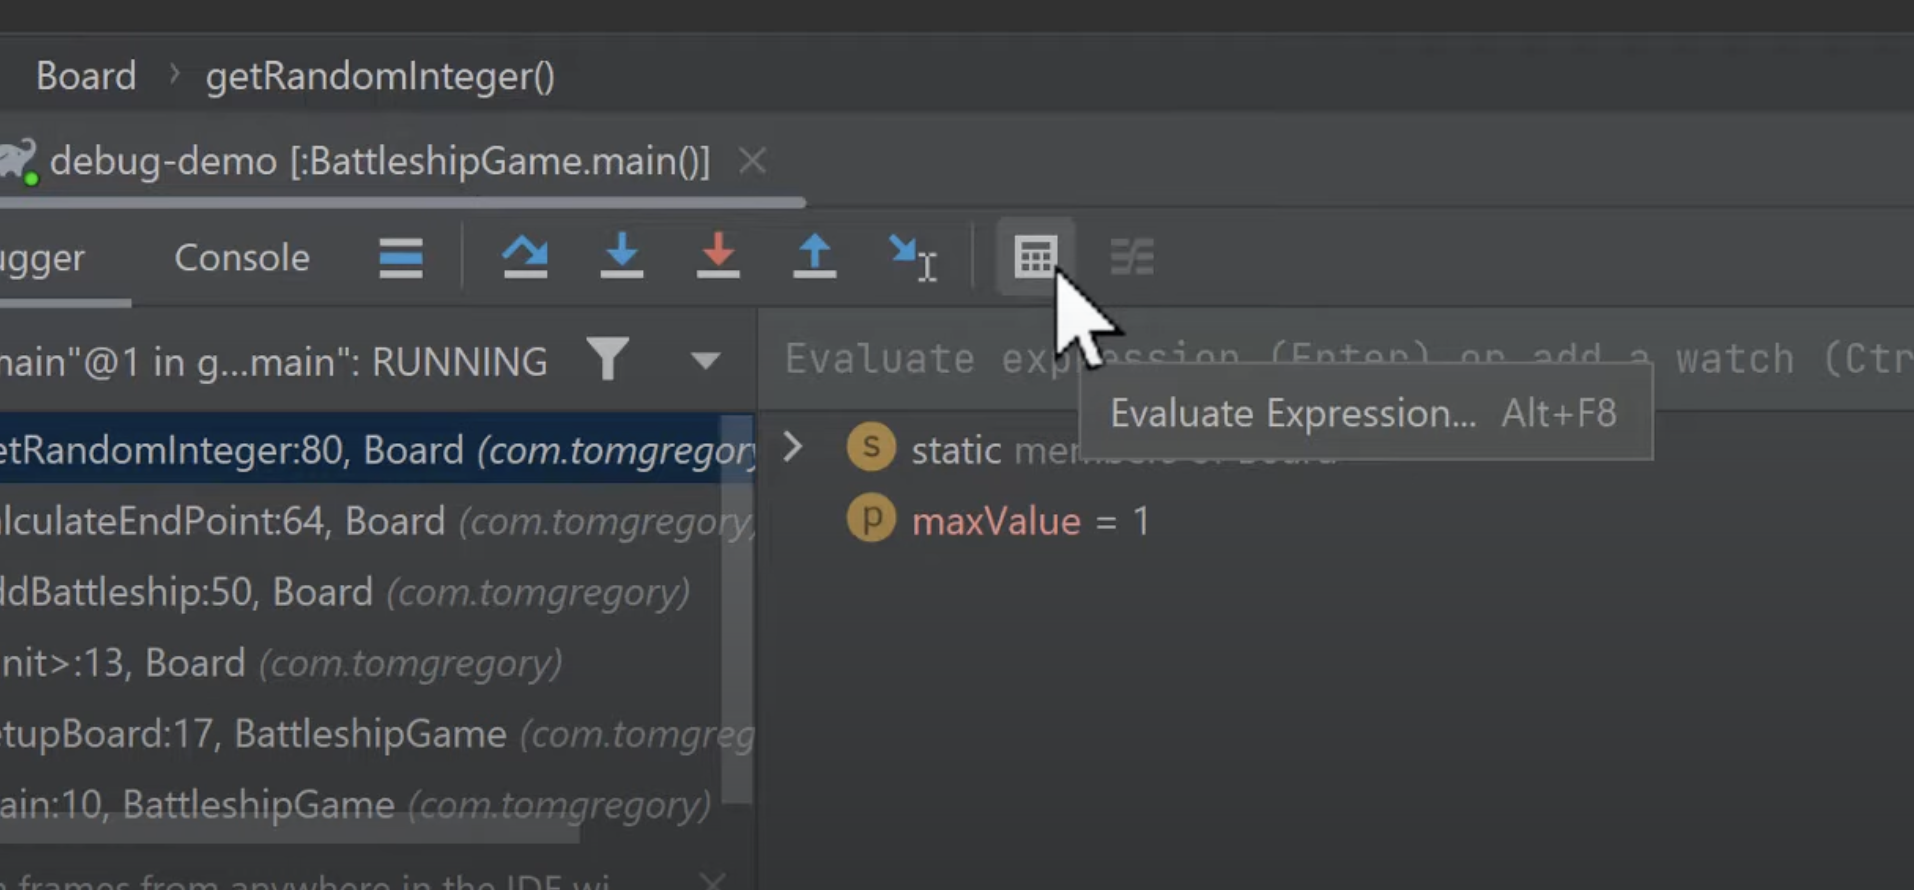
[image credit: Tom Gregory Tech]
More info from Intellij Docs is here.
Set an exception breakpoint
Purpose: To pause execution whenever a specified exception is thrown, regardless of where it occurs in your code, making it easier to identify and diagnose issues.
How: Choose Run > View Breakpoints from the main menu, and use the icon to add an exception breakpoint, as shown below.
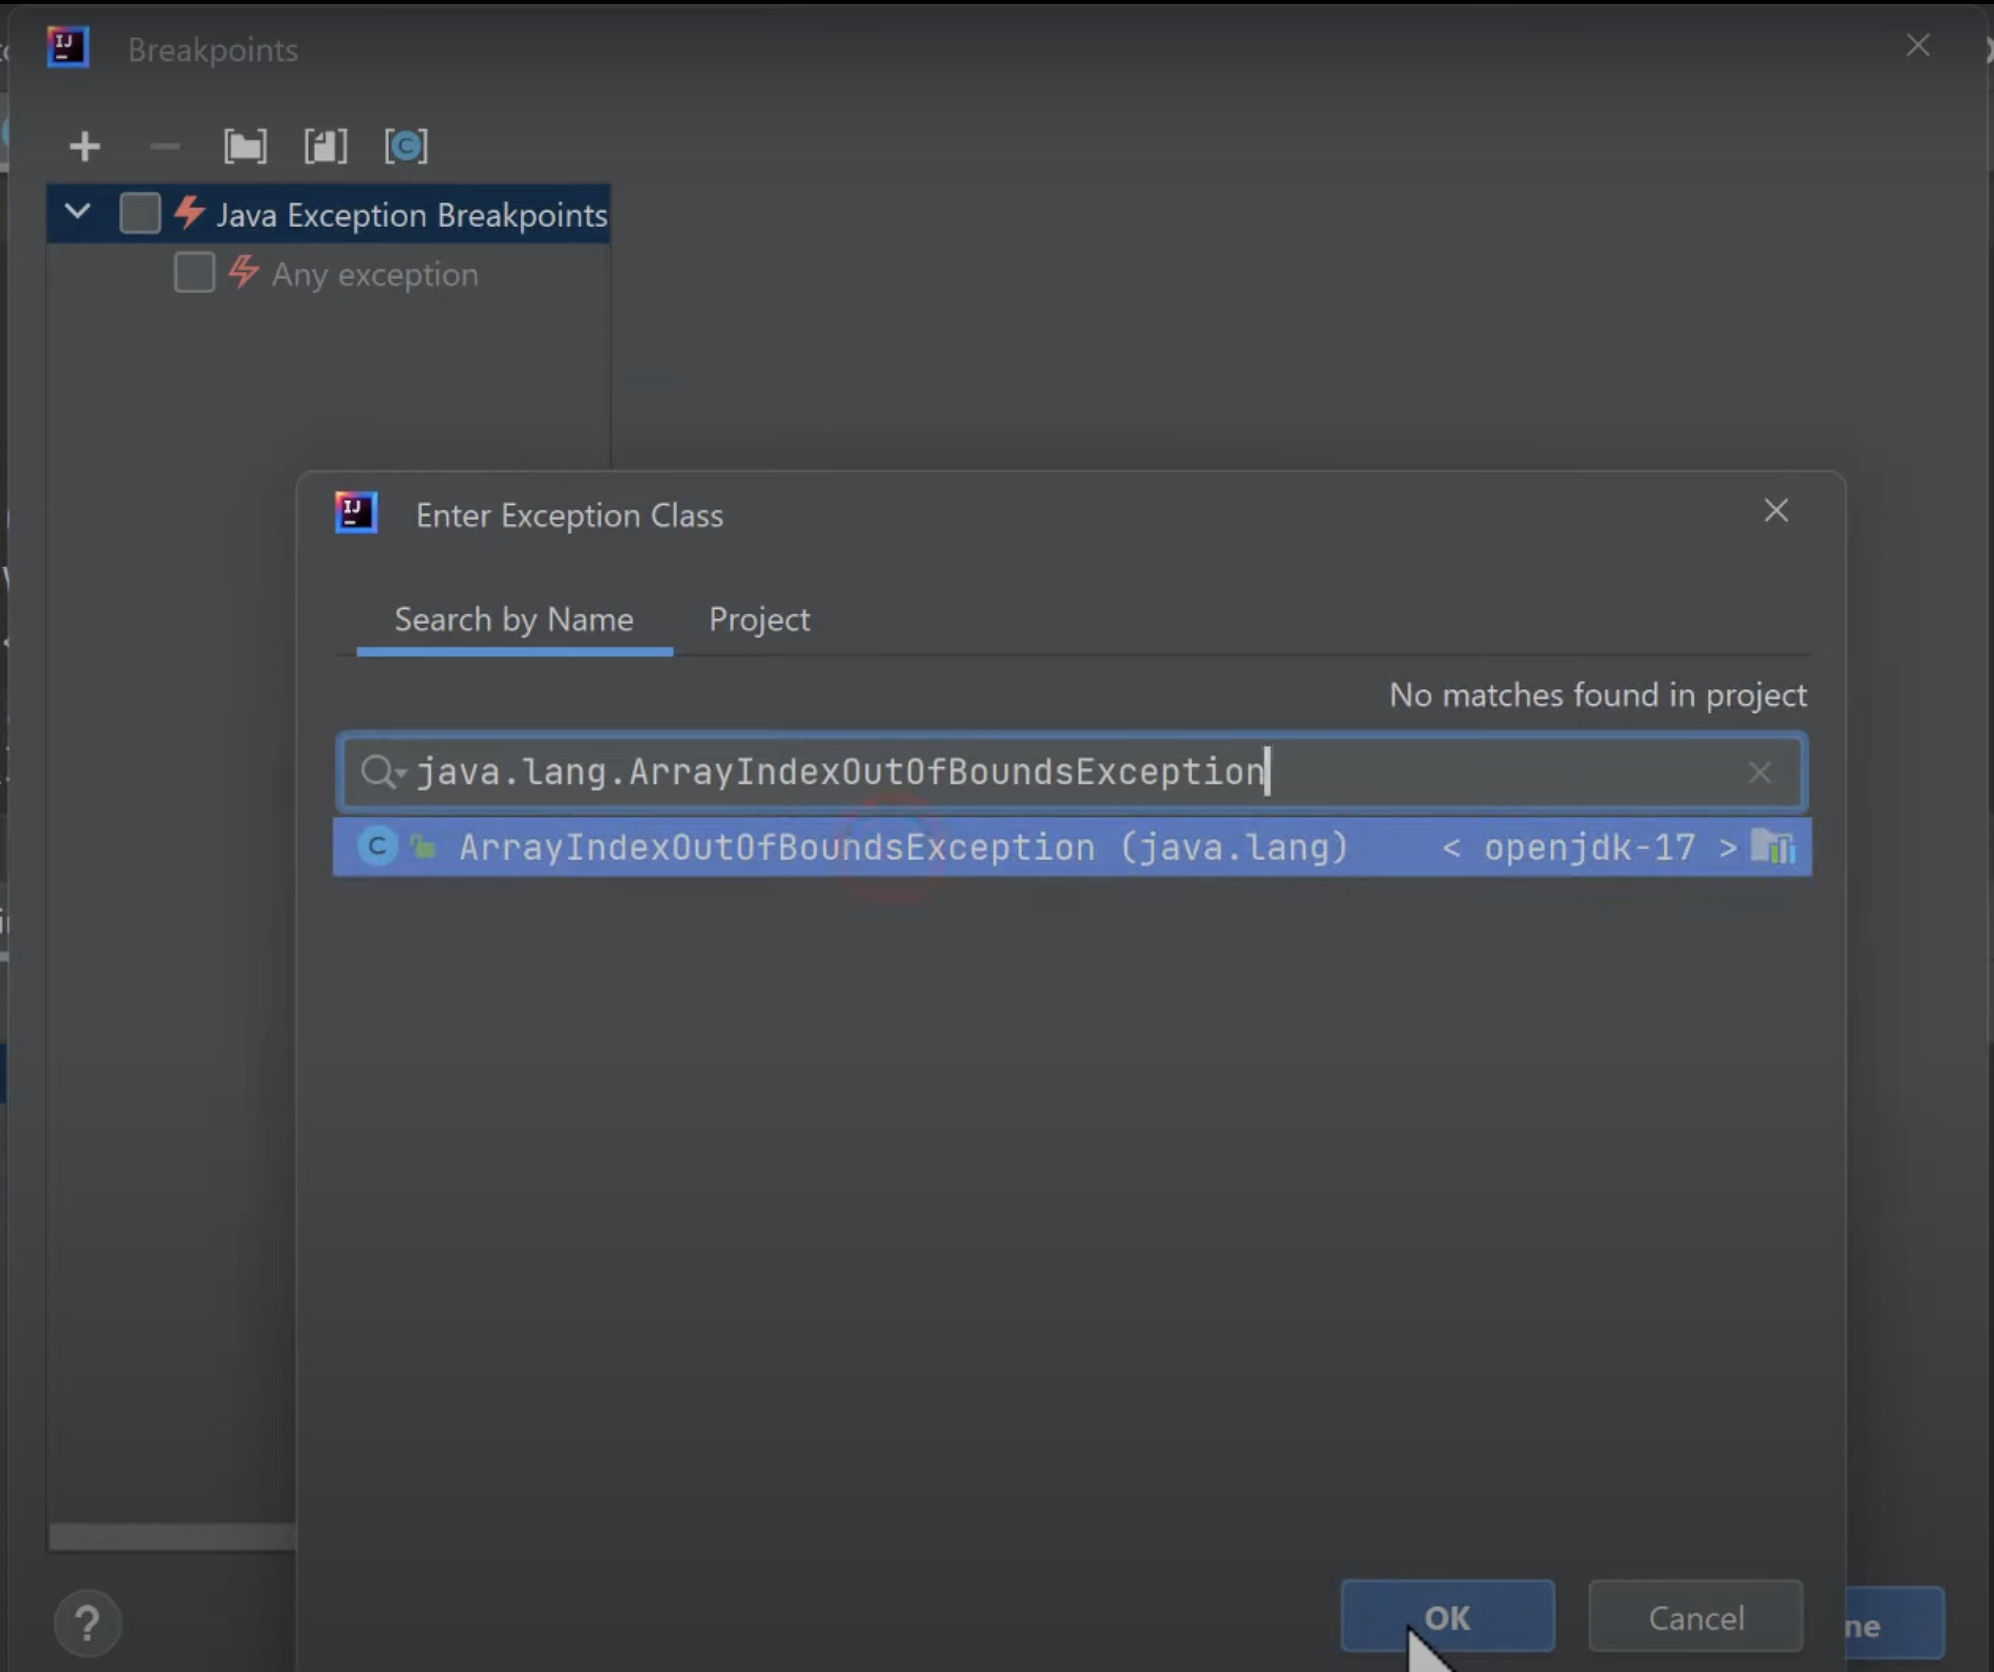
[image credit: Tom Gregory Tech]
More info from Intellij Docs is here.
Authors:
- Initial Version: @ruishanteo