Guides for SE student projects »
This is a WIP community resource, containing contributions from community members.
- If you notice any bugs or have suggestions for improvements, please report at https://github.com/se-edu/guides/issues
- You are welcome to contribute by sending a PR to https://github.com/se-edu/guides/pulls too.
VS Code - Using the Debugger
This tutorial covers the basics of using VS Code’s debugger for Java features.
If you are new to using an IDE-based debugger, we recommend watching the video below for an introduction to the features of VS Code Java debugger.
To recall how to use a specific feature, you can refer to the sections below.
Prerequisites
Ensure you have followed our guide on Preparing VS Code for Java.
- In particular, ensure you have the Debugger for Java extension installed from VS Code Marketplace
Adding breakpoints
Purpose: A breakpoint is a line in the code at which the debugger will pause the execution.
How: Click in the left margin next to the line of code where you want to set the breakpoint. A red dot will appear in the margin.
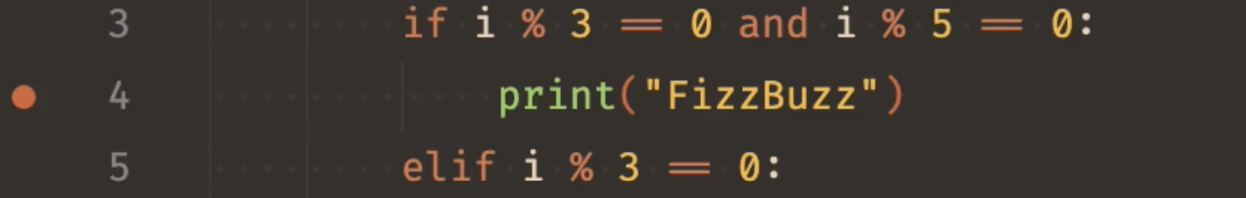
[image credit: VS Code Docs]
To remove the breakpoint, click the red dot again. Remember to remove breakpoints after you are done debugging that section, so they do not interfere when debugging other parts of the code later.
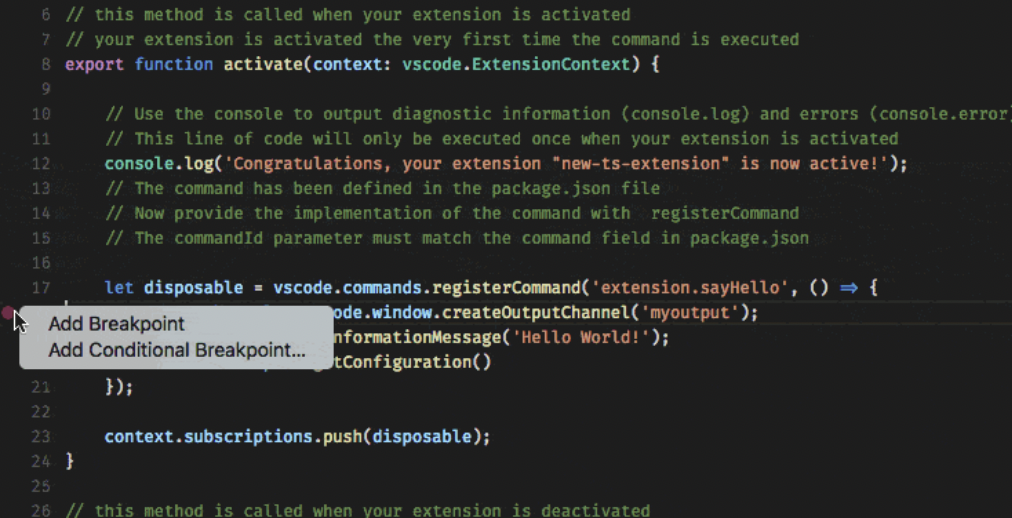
- The Debugger for Java supports various breakpoints, including line breakpoints, conditional breakpoints, data breakpoints, and logpoints.
- Different types of breakpoints can be added by right-clicking in the left margin and selecting which type of breakpoint you want to add (line breakpoints, conditional breakpoints, and logpoints).
Video segment 4.57 - 6.04 :
More info from VS Code Docs is here.
Running the code in Debug mode
Purpose: To get VS Code to run the code in the debugger mode, so that the debugger can direct the execution flow as needed by the debugging.
How: Here are some ways to launch the Debugger:
- Click on the dropdown arrow beside the play icon (top editor title bar) and select
Debug Java - If 'Debug Java' isn’t visible, ensure your file contains a
mainmethod and that the Java debugger extension is installed and active. - Click on
Debugoption right abovemainmethod - Alternatively /
F5|Fn+F5
By default, the debugger will run out-of-box by automatically finding the main class and generating a default launch configuration in memory to launch your application.
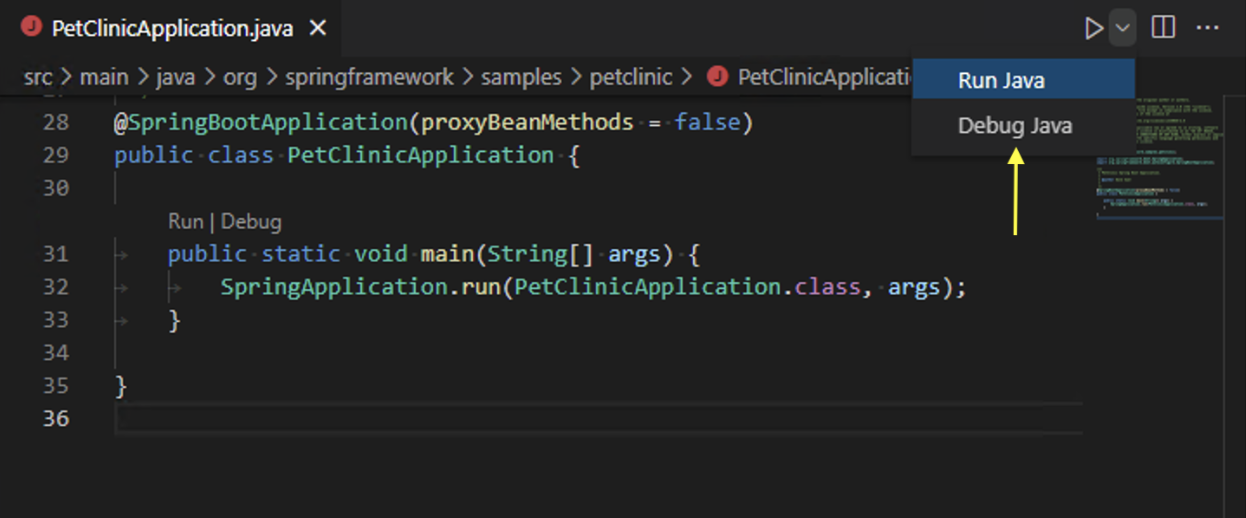
[image credit: VS Code Docs]
Video segment 4.34 - 5.05 :
More info from VS Code Docs is here.
Examining the state of the suspended programme
Purpose: To examine values of variables at different steps of the execution
How: Use the Debug Console panel at the bottom of the window. At each breakpoint, you can see:
- Variables: All local variables and their current values.
- Watch: You can add specific expressions to observe.
- Call Stack: Shows the current stack of method calls.
- Breakpoints: Lists all active breakpoints.
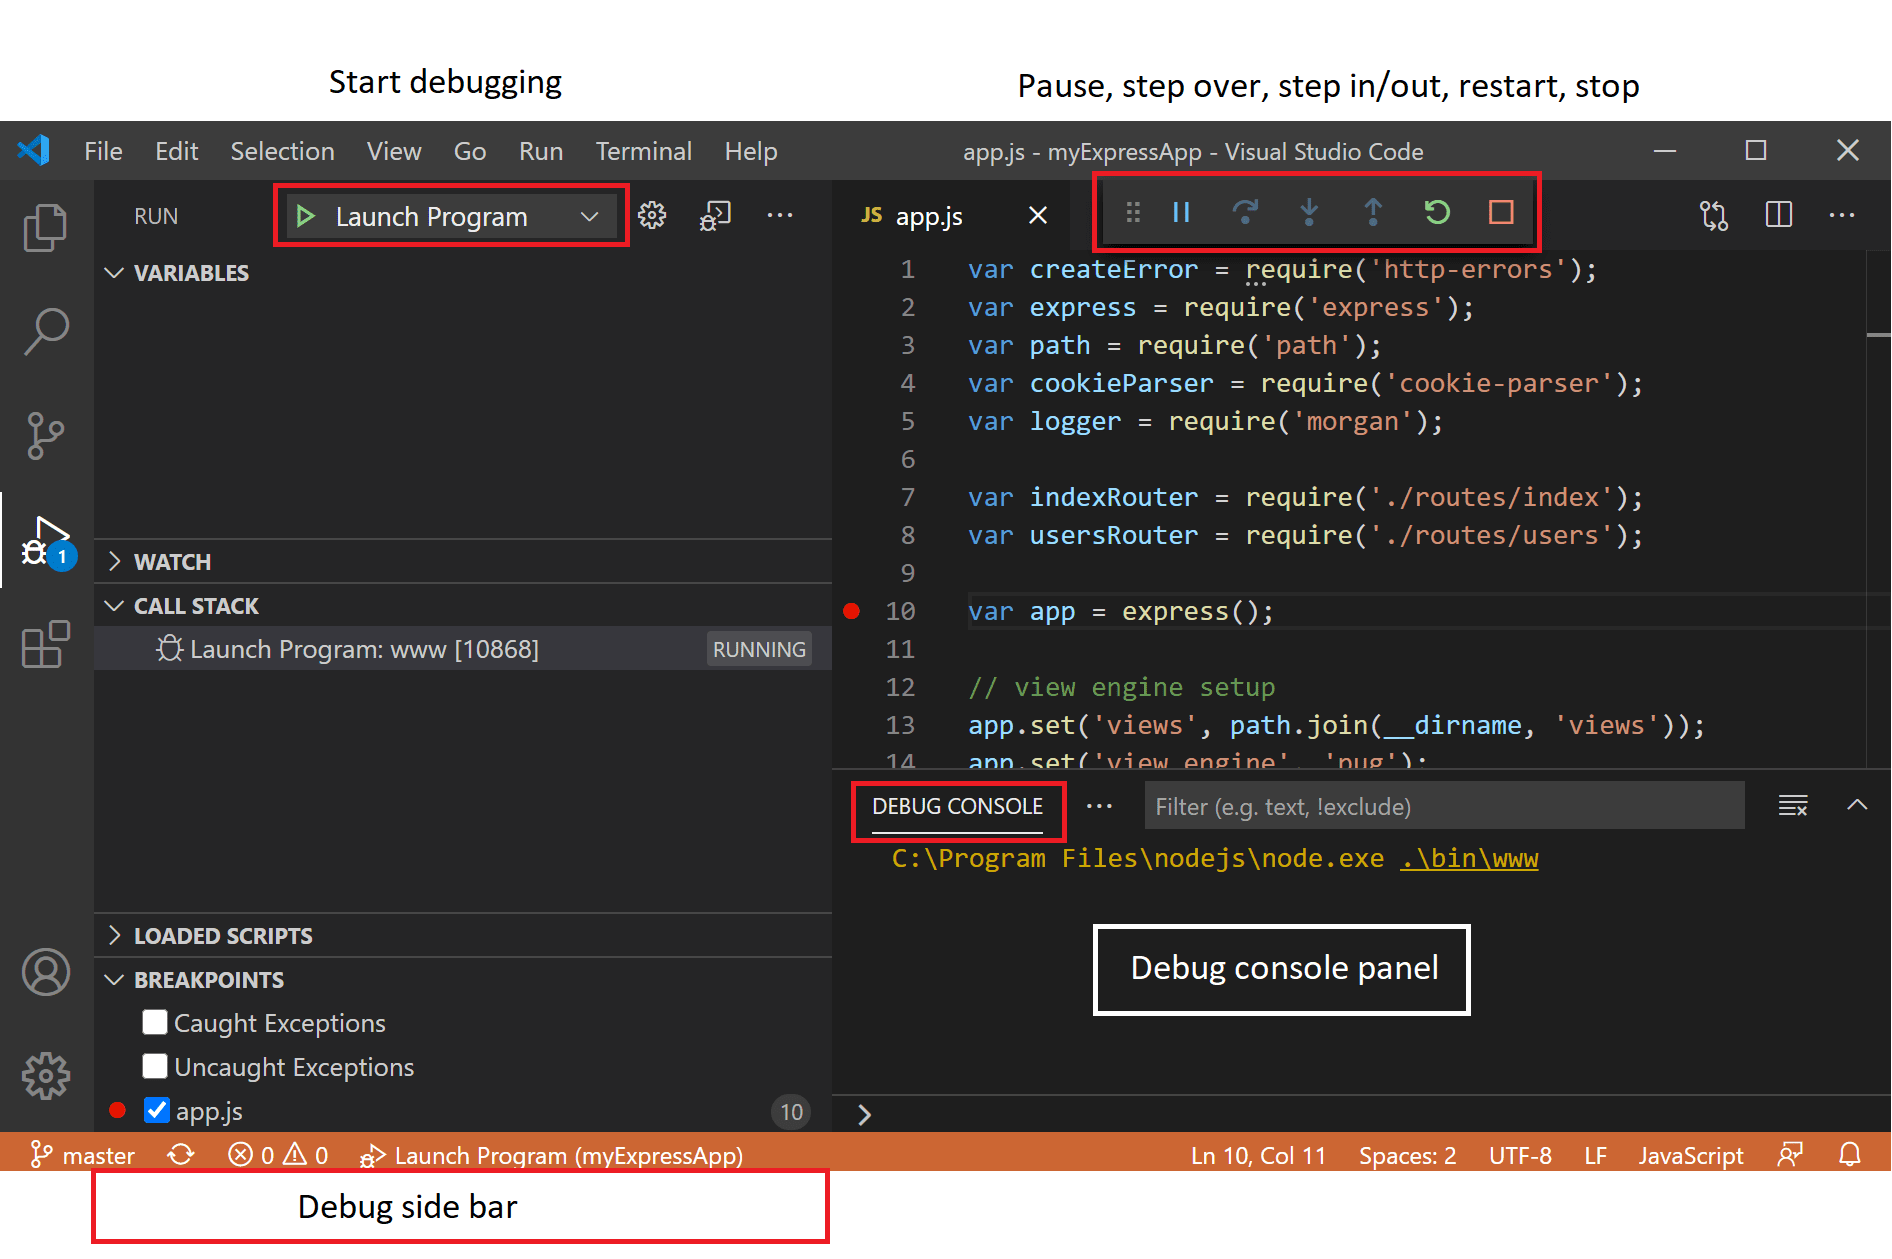
[image credit: VS Code Docs]
Video segment 8.19 - 8.47 :
More info from VS Code Docs is here.
Stepping through code
Purpose: To move through code line by line and observe how it is executed
How: Click the Step Over button (curved arrow) in the debug toolbar (/ F10 | Fn+F10)

[image credit: VS Code Docs]
Video segment 8.00 - 8.19 :
More info from VS Code Docs is here.
Stepping into a method
Purpose: To enter a method being called on the current line to see how it behaves
How: Click the Step Into button (down arrow) (/ F11 | Fn+F11)
[image credit: VS Code Docs]
More info from VS Code Docs is here.
Stepping out of a method
Purpose: To finish executing the current method and return to its caller, without stepping through the rest of it.
How: Click the Step Out button (up arrow) (/ Shift+F11 | Fn+Shift+F11)
[image credit: VS Code Docs]
More info from VS Code Docs is here.
Setting a Conditional Breakpoint
Purpose: To pause the execution at a certain breakpoint only when a certain condition is met (E.g. when i == 100)
How:
- Right-click in the editor margin and select "Edit Breakpoint"
- Choose the type of condition you want to set (expression, hit count, or wait for breakpoint)
[image credit: VS Code Docs]
More info from VS Code Docs is here.
Setting a Data Breakpoint
Purpose: To pause the execution at a certain breakpoint when a variable changes its value
How:
- First, run the application and break on a normal breakpoint
- Then pick a field in the VARIABLES view and set a data breakpoint
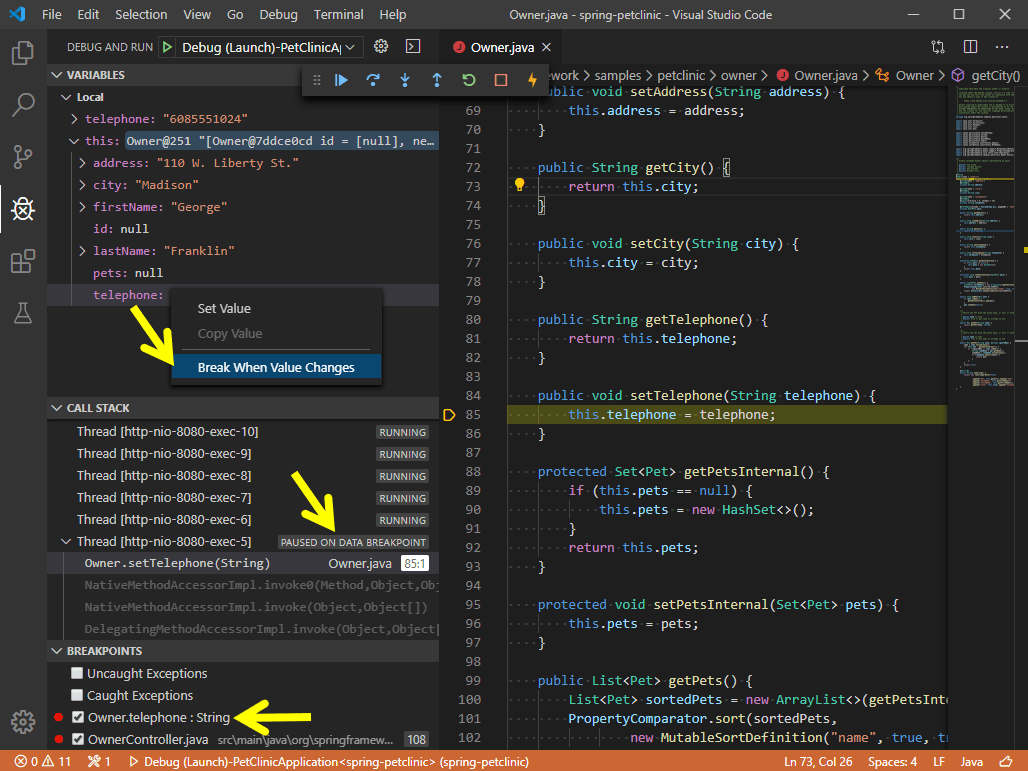
[image credit: VS Code Docs]
More info from VS Code Docs is here.
Setting a Logpoint
Purpose: Logpoints are useful for printing debug messages without modifying your source code, especially in read-only files or production environments.
- E.g. when calculating sums, logpoints allow you to keep track of the function without numerous
printstatements and keeping codebase clean!
How:
- Right click in the editor margin and select "Add Logpoint"
- Enter the value that you want to be output in the Debug Console (e.g. the value of results.size() in a loop)
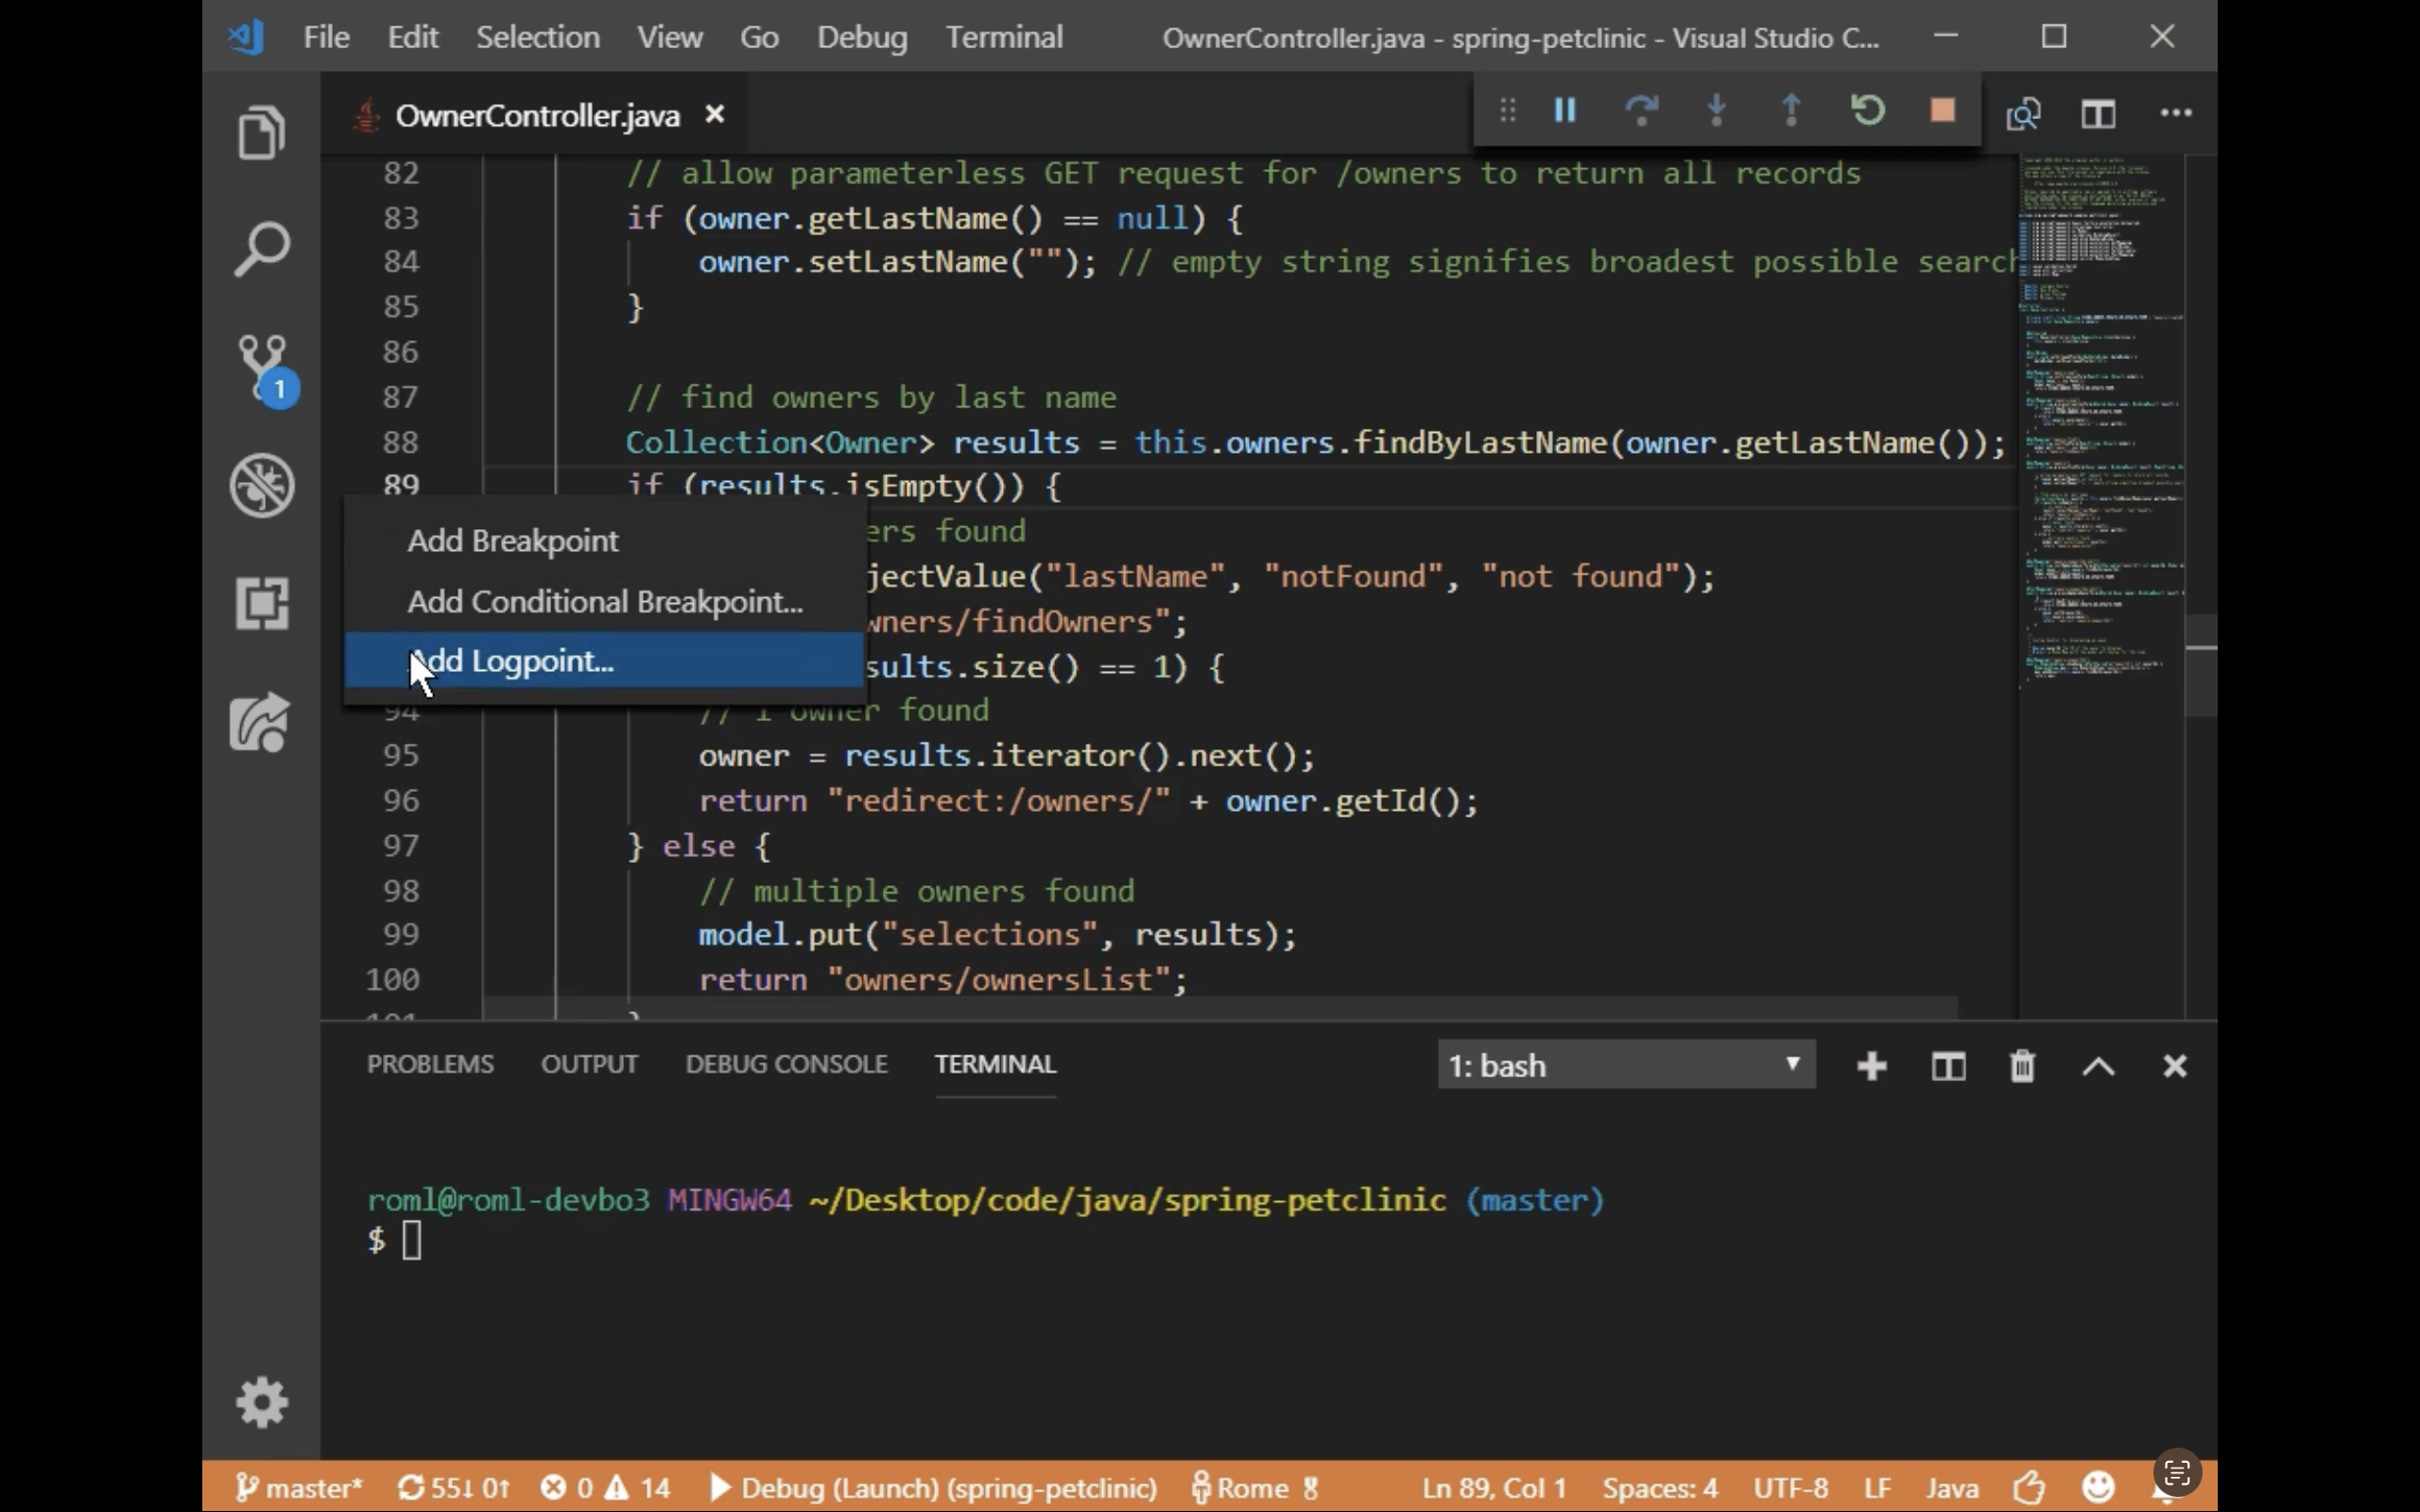
[image credit: VS Code Docs]
More info from VS Code Docs is here.
Evaluating Expressions
Purpose: Allows you to compute the value of an expression at a specific point during execution, enabling dynamic inspection of variables and data structures.
How: Enter through the WATCH window, or the Debug Console
More info from VS Code Docs is here.
Advanced Debugging Features
Hot-Code Replace
Purpose: Allows you to change and recompile code without restarting the debugging session, while paused at a breakpoint
More info from VS Code Docs is here.
Configuration Options
Purpose: You can configure the debugger using the options and settings. JVM arguments and environment variables is easily done with launch options.
To customize how your program is launched (e.g. passing arguments or setting environment variables), you can modify the .vscode/launch.json file.
More info from VS Code Docs is here.
Troubleshooting
Problem: Debugger won't start, debugger process terminated abruptly
Solution:
- Ensure JDK is installed (
java --versionandjavac --version) - Verify
launch.json: Correct mainClass path e.g. 'com.example.Main'
Problem: Breakpoints not working, code runs but does not pause at breakpoints
Solution:
- Run
Clean/Rebuildin VS Code (/Ctrl+Shift+P|Cmd+Shift+P> "Java: Clean the Java Language Server Workspace"). - For Maven/Gradle:
mvn clean compile/gradle clean build
Problem: Class not found or Error: "Could not find or load main class"
Solution:
- Ensure
src/main/javaexists - /
Ctrl+Shift+P|Cmd+Shift+P> "Java: List all Java source paths" to show all source paths recognized by the workspace. - Refresh the workspace: /
Ctrl+Shift+P|Cmd+Shift+P> "Java: Reload Projects".
If you encounter other issues when using the VS Code debugger, refer to the detailed troubleshooting guide given here.
Contributors: Sulaksha Muthukrishnan (@crmlatte)