Software Engineering for Self-Directed Learners »

Project planning

Work breakdown structure

Can explain work breakdown structures

A Work Breakdown Structure (WBS) depicts information about tasks and their details in terms of subtasks. When managing projects, it is useful to divide the total work into smaller, well-defined units. Relatively complex tasks can be further split into subtasks. In complex projects, a WBS can also include prerequisite tasks and effort estimates for each task.

The high level tasks for a single iteration of a small project could look like the following:

Task ID Task Estimated Effort Prerequisite Task
A Analysis 1 man day -
B Design 2 man day A
C Implementation 4.5 man day B
D Testing 1 man day C
E Planning for next version 1 man day D

The effort is traditionally measured in man hour/day/month i.e. work that can be done by one person in one hour/day/month. The Task ID is a label for easy reference to a task. Simple labeling is suitable for a small project, while a more informative labeling system can be adopted for bigger projects.

An example WBS for a game development project.

Task ID Task Estimated Effort Prerequisite Task
A High level design 1 man day -
B Detail design
  1. User Interface
  2. Game Logic
  3. Persistency Support
2 man day
  • 0.5 man day
  • 1 man day
  • 0.5 man day
A
C Implementation
  1. User Interface
  2. Game Logic
  3. Persistency Support
4.5 man day
  • 1.5 man day
  • 2 man day
  • 1 man day
  • B.1
  • B.2
  • B.3
D System Testing 1 man day C
E Planning for next version 1 man day D

All tasks should be well-defined. In particular, it should be clear as to when the task will be considered done.

Some examples of ill-defined tasks and their better-defined counterparts:

Bad Better
more coding implement component X
do research on UI testing find a suitable tool for testing the UI

Exercises


Milestones

Can explain milestones

A milestone is the end of a stage which indicates significant progress. You should take into account dependencies and priorities when deciding on the features to be delivered at a certain milestone.

Each intermediate product release is a milestone.

In some projects, it is not practical to have a very detailed plan for the whole project due to the uncertainty and unavailability of required information. In such cases, you can use a high-level plan for the whole project and a detailed plan for the next few milestones.

Milestones for the Minesweeper project, iteration 1

Day Milestones
Day 1 Architecture skeleton completed
Day 3 ‘new game’ feature implemented
Day 4 ‘new game’ feature tested

Buffers

Can explain buffers

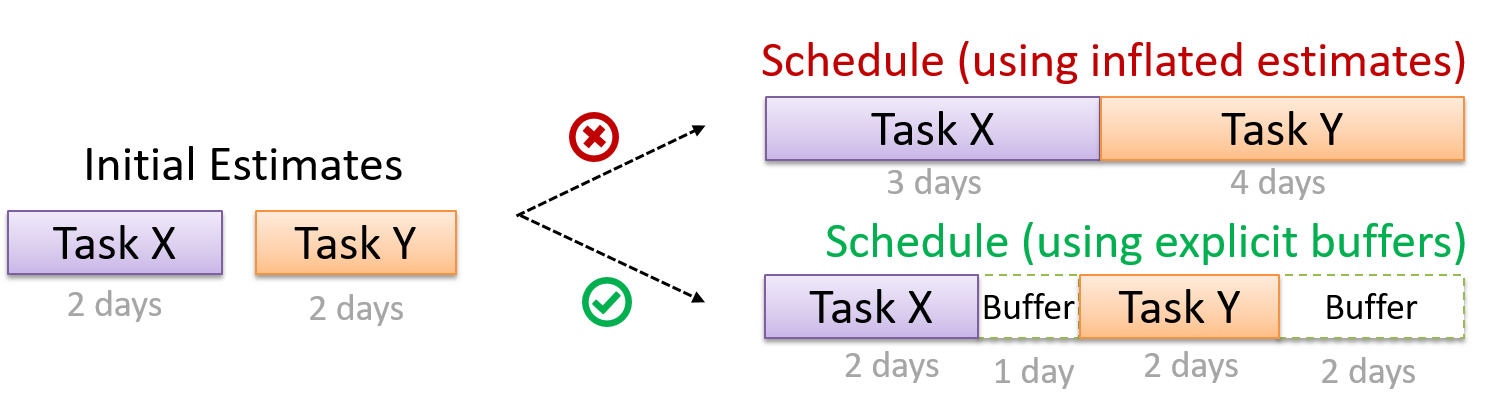
A buffer is time set aside to absorb any unforeseen delays. It is very important to include buffers in a software project schedule because effort/time estimations for software development are notoriously hard. However, do not inflate task estimates to create hidden buffers; have explicit buffers instead. Reason: With explicit buffers, it is easier to detect incorrect effort estimates which can serve as feedback to improve future effort estimates.


Issue trackers

Can explain issue trackers

Keeping track of project tasks (who is doing what, which tasks are ongoing, which tasks are done etc.) is an essential part of project management. In small projects, it may be possible to keep track of tasks using simple tools such as online spreadsheets or general-purpose/light-weight task tracking tools such as Trello. Bigger projects need more sophisticated task tracking tools.

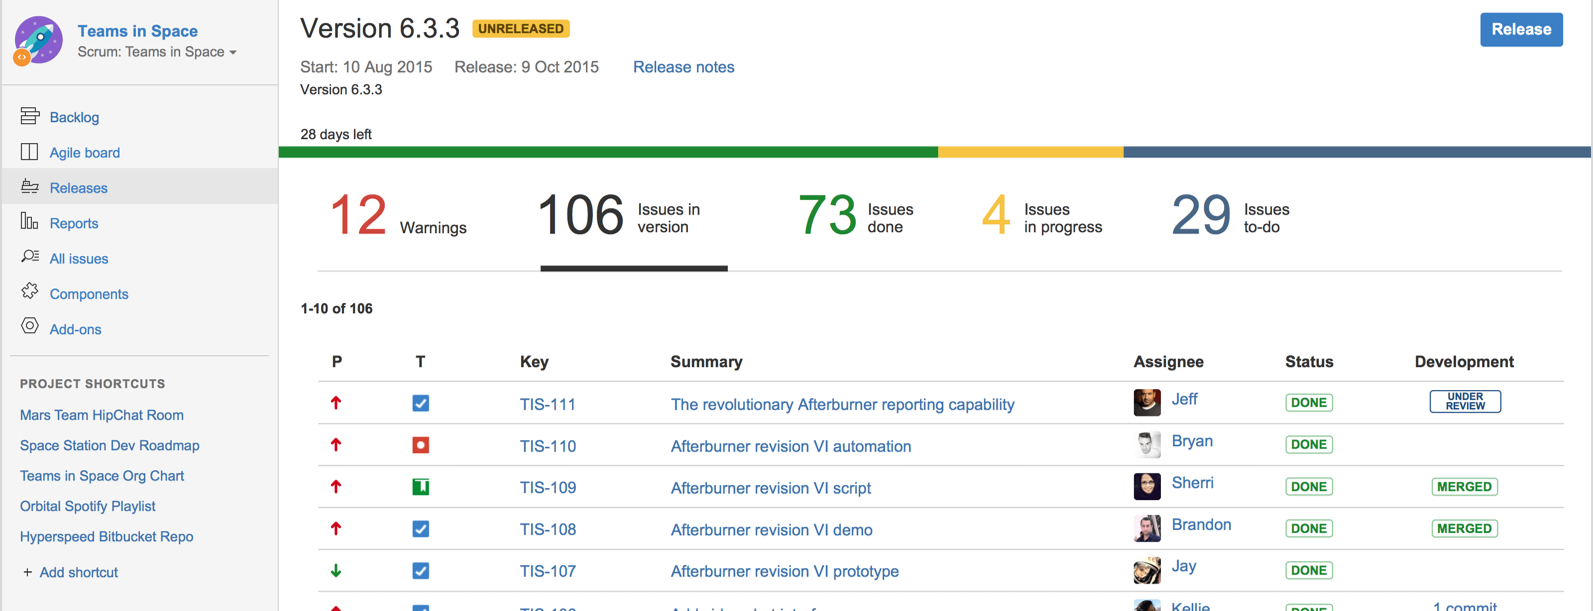
Issue trackers (sometimes called bug trackers) are commonly used to track task assignment and progress. Most online project management software such as GitHub, SourceForge, and BitBucket come with an integrated issue tracker.

A screenshot from the Jira Issue tracker software (Jira is part of the BitBucket project management tool suite):


Gantt charts

Can explain Gantt charts

A Gantt chart is a 2-D bar-chart, drawn as time vs tasks (represented by horizontal bars).

A sample Gantt chart:

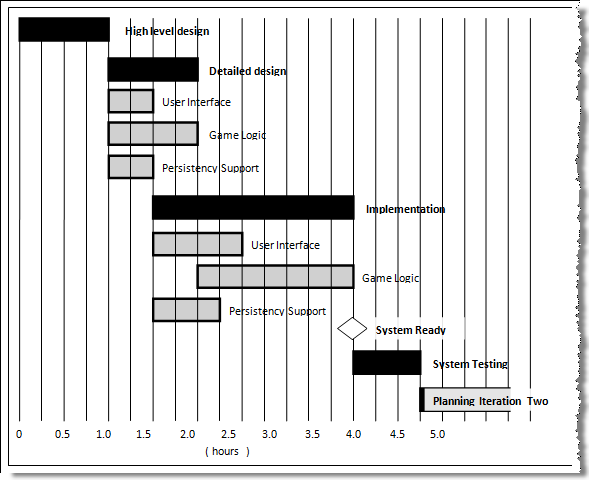
In a Gantt chart, a solid bar represents the main task, which is generally composed of a number of subtasks, shown as grey bars. The diamond shape indicates an important deadline/deliverable/milestone.


PERT charts

Can explain PERT charts

A PERT (Program Evaluation Review Technique) chart uses a graphical technique to show the order/sequence of tasks. It is based on the simple idea of drawing a directed graph in which:

  • Nodes or vertices capture the effort estimations of tasks, and
  • Arrows depict the precedence between tasks

An example PERT chart for a simple software project
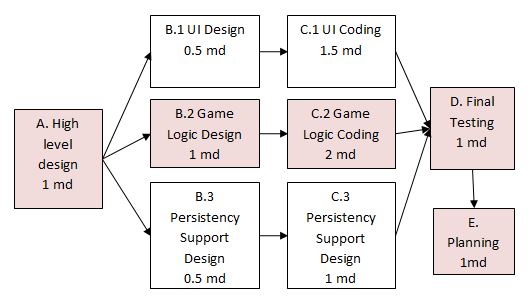

md = man days

A PERT chart can help determine the following important information:

  • The order of tasks. In the example above, Final Testing cannot begin until all coding of individual subsystems have been completed.
  • Which tasks can be done concurrently. In the example above, the various subsystem designs can start independently once the High level design is completed.
  • The shortest possible completion time. In the example above, there is a path (indicated by the shaded boxes) from start to end that determines the shortest possible completion time.
  • The Critical Path. In the example above, the shortest possible path is also the critical path.

Critical path is the path in which any delay can directly affect the project duration. It is important to ensure tasks on the critical path are completed on time.